Nationwide, employees are feeling empowered to leave their jobs. Chances are you’ve noticed because your organization is experiencing the phenomenon firsthand. Good news: You can take several steps to retain great employees. But to do so, you have to understand why they’re leaving.
According to Gallup’s State of the American Workplace, 51% of employees are looking for a new job, actively or passively, while 91% of new hires left a job to start their new one. Several factors influence high turnover – so how can you know which ones fuel turnover at your organization, and where you should focus your retention efforts?
Use the workforce data you already have on hand to identify patterns of turnover or “hot spots.” This will help you strategically examine your retention efforts and resolve issues prompting high turnover.
Step 1: Start with a bird’s eye view of company turnover
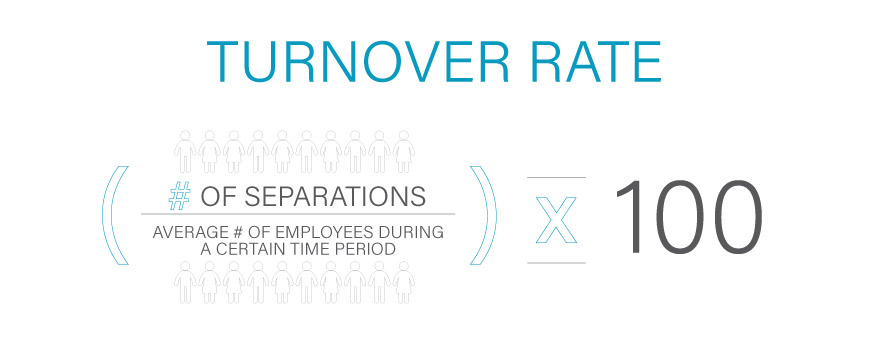
Turnover rate
Calculate your turnover rate by dividing the total number of employee separations by the average number of employees during that time period. Multiply the result by 100.
Turnover cost
To calculate the cost of your company’s turnover, multiply the average cost of replacing that type of employee by the average employee salary. Then multiply the result by the number of separated employees in a given time period.
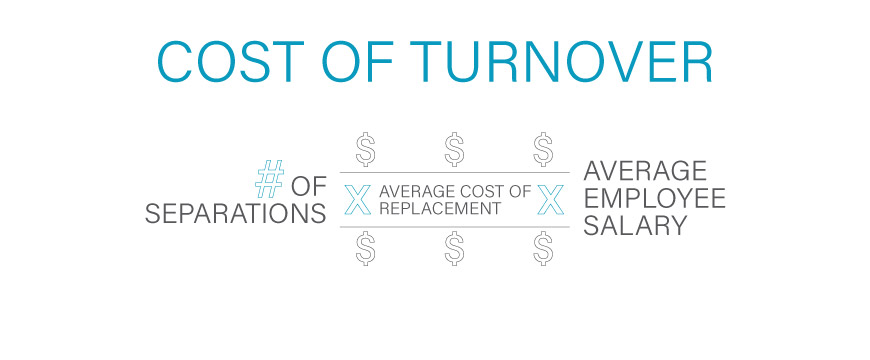
The average cost of replacing an employee varies, but typically, you’ll spend approximately 50% of a worker’s salary to find a replacement. For an executive-level position, the percentage rises to 200%.
For example, here’s how you would calculate the cost of annual turnover if you’re a restaurant that:
- typically replaces 25 employees each year and
- your employees average $10 per hour working 40 hours per week ($20,800 annually):
25 x (.50 x $20,800) = $260,000 annual turnover cost
Remember: Calculating turnover rates and costs for your entire company is the first step in pinpointing and solving retention issues, but it’s not the only step. Unfortunately, most companies stop at this stage and consider it actionable information. It’s not.
General turnover rates and costs alone can show you scope of the problem, not the cause. To gain the kind of understanding you need to strategically reduce turnover, you must know specific areas of your business in which turnover is high, and why that is.
Follow Steps 2 and 3 to do so.
Step 2: Use what you already know to develop a hypothesis
Before you continue, take the formulas you used to calculate company-wide turnover costs in step one, and put them aside for the moment. You’ll need them later, but not for this step.
In this step, use information – like departmental turnover rates and employee feedback – to establish a theory on where turnover “hot spots” might be in your company and why they’re happening. In other words, develop an educated guess. While speculative, that guess gives you a place to start, and a hypothesis of sorts to test.
Start by making a list of areas or groups in your company that may have the potential for high turnover. Include in your list any groups you know struggle with high turnover – a department that has faced significant changes in leadership, or maybe the team that seems to be backfilling positions constantly. Then, review feedback employees in those departments have expressed in surveys, performance reviews (if applicable) and informal conversations. In your review, look for the following sentiments; they’re often common contributors to turnover:
- turnover after a busy season or major company event
- lack of technology to aid productivity
- mismatch between expectations and reality for new hires
- culture that is unwelcoming to certain groups of employees
- compensation or benefits that aren’t competitive
- limited opportunities for advancement
- low engagement (only 33% of American employees are actively engaged)
Use this information to inform your hypothesis as to where turnover hot spots exist and why they’re happening.
Step 3: Prove/disprove your theory on turnover hot spots
Once you’ve built your best educated guess, you’ll need to pull employee data, including a list of termed employees, EEO status, termination date, tenure, department and supervisor.
You can do this either by running a report in a single-database HR software, or by pulling data from multiple HR tools and compiling them into a spreadsheet.

If you pull data from multiple HR applications – one for talent management, another for payroll data, maybe a separate tool for expense management – you may need to create different spreadsheets to compare multiple types of data. For example, you may want to create one spreadsheet comparing turnover within one department and the supervisors within it, but another that compares turnover, Equal Employment Opportunity (EEO) status and tenure. Keep notes of your process and the fields you’re comparing so you can replicate these reports later for accurate month-over-month and year-over-year data.
Paycom’s software allows you to save and run reports with the same categories indefinitely, so you can create the matrix you want (like your termed employees list combined with termination dates, departments, etc.), save the report, and run that report on new information quarterly or even monthly without having to download data and create a new spreadsheet every time. Instead, you can set the report to run and send to the people who need to see it – automatically.
Paycom clients also can access all employee information in one database, so you don’t have to download data from each software suite, compile it in a spreadsheet, come back to it in a month, re-download everything and re-compile the spreadsheet, trying to remember exactly how you did it the first time (or digging through your notes) to make sure that it’s consistent from month to month.
However you compile the data, once you’ve done so, you’ll want to compare your termed employee list with the following data points, and ask yourself the following questions to identify turnover hot spots and understand the potential reason behind them:
EEO status
Does your organization see high turnover within particular minority groups? Higher-than-average turnover for specific races/ethnicities or genders may indicate a culture issue worth investigating.
What about EEO status for different positions? If some roles have high turnover, ask leadership and the supervising managers for their take on the trend. Do they think there is an issue with the position itself? A compensation gap? Has there been a recent change in the department that might have prompted a one-time spike in turnover?
Termination date
Does turnover increase after annual reviews? After your company’s busy season ends? Could significant changes at the organization or industry level have influenced a jump in turnover?
Tenure
Are you struggling to keep employees longer than three years? Does your company provide enough growth opportunities to get people to stay for a long time? Do you find many employees leaving shortly after onboarding? They may not have received a realistic idea of their new job during the recruiting process.
Department
Do certain departments have high turnover? Consider what you know about the department: Has leadership or operations changed recently? Is its culture a healthy one?
Supervisor
If you find employee turnover is higher under a certain supervisor or leader and want to know more specifics, you may need to drill down further to discover the cause. Can you find a trend between the performance reviews the supervisor gives or receives? HR may need to intervene to provide guidance or feedback in this situation.
Once you have an understanding of where and why turnover may be happening, you have a basis for creating recommendations on how to strategically reduce churn.
Step 4: Prove the business case for addressing hot spots
Congratulations! You have identified turnover hot spots, investigated the cause and gathered your recommendations for solving the problem. But how do you make the case for necessary improvements, especially if your recommendations require additional investment in certain areas of your company?
To bring it full circle, show how the turnover in a certain department, role or season (or anything else) affects your company. Identify trends in the data and then calculate the cost of turnover for each specific trend, using the formula from Step 1. This can help you make the business case for specific, targeted solutions to address the root cause of turnover issues, rather than putting money toward general retention efforts that may not work.

For example, let’s say your company always experiences an increase in employee exits after your busy season ends. Executive leadership isn’t particularly worried because this spike has occurred for as long as anyone can remember, and it isn’t a large number of employees. But you know it’s money the company can better use elsewhere.
If these employees average $40,000 a year and you typically lose just 20 after each busy season, here’s how much that’s costing your company – assuming you’ll spend 50% of each employee’s salary on recruiting, hiring and training replacements.
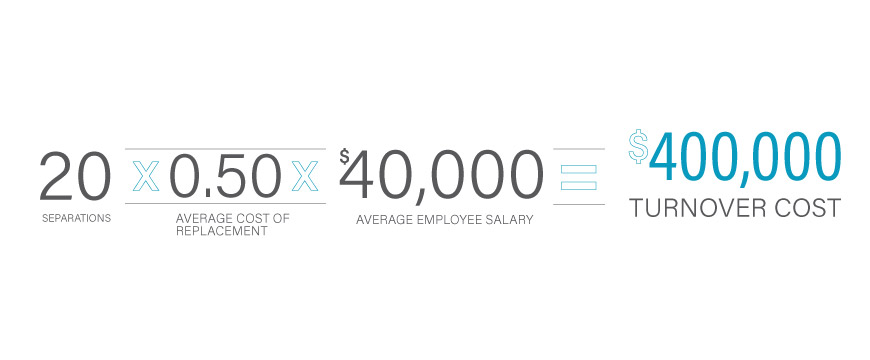
Since that turnover is predictable – therefore, potentially preventable – working out the big-picture financial cost of the seemingly minor amount of turnover can help you make the case for possible solutions. What else could your company do with $400,000?
Accurate data on turnover hot spots can help you not only reveal areas for increased retention efforts, but communicate to other leaders about the business case for those efforts. Having all your employee data in one database? That empowers you get the data quickly and move on to everything else on your plate.
Disclaimer: This blog includes general information about legal issues and developments in the law. Such materials are for informational purposes only and may not reflect the most current legal developments. These informational materials are not intended, and must not be taken, as legal advice on any particular set of facts or circumstances. You need to contact a lawyer licensed in your jurisdiction for advice on specific legal problems.
